Query with PromQL in CloudWatch
Amazon CloudWatch Query Studio is a unified query interface that lets you explore metrics using both PromQL (Prometheus Query Language) and SQL syntax. This provides a unified interface to explore Container Insights infrastructure metrics and application metrics — all without needing a separate Prometheus server. It provides auto-completion, a metric browser, and a visual query builder so you can explore OpenTelemetry-ingested metrics, enriched AWS vended metrics, and custom application metrics from a single pane.
In this section we'll explore how to query the metrics collected by the OpenTelemetry-based CloudWatch agent using PromQL directly in Amazon CloudWatch Query Studio.
 Open CloudWatch Query Studio
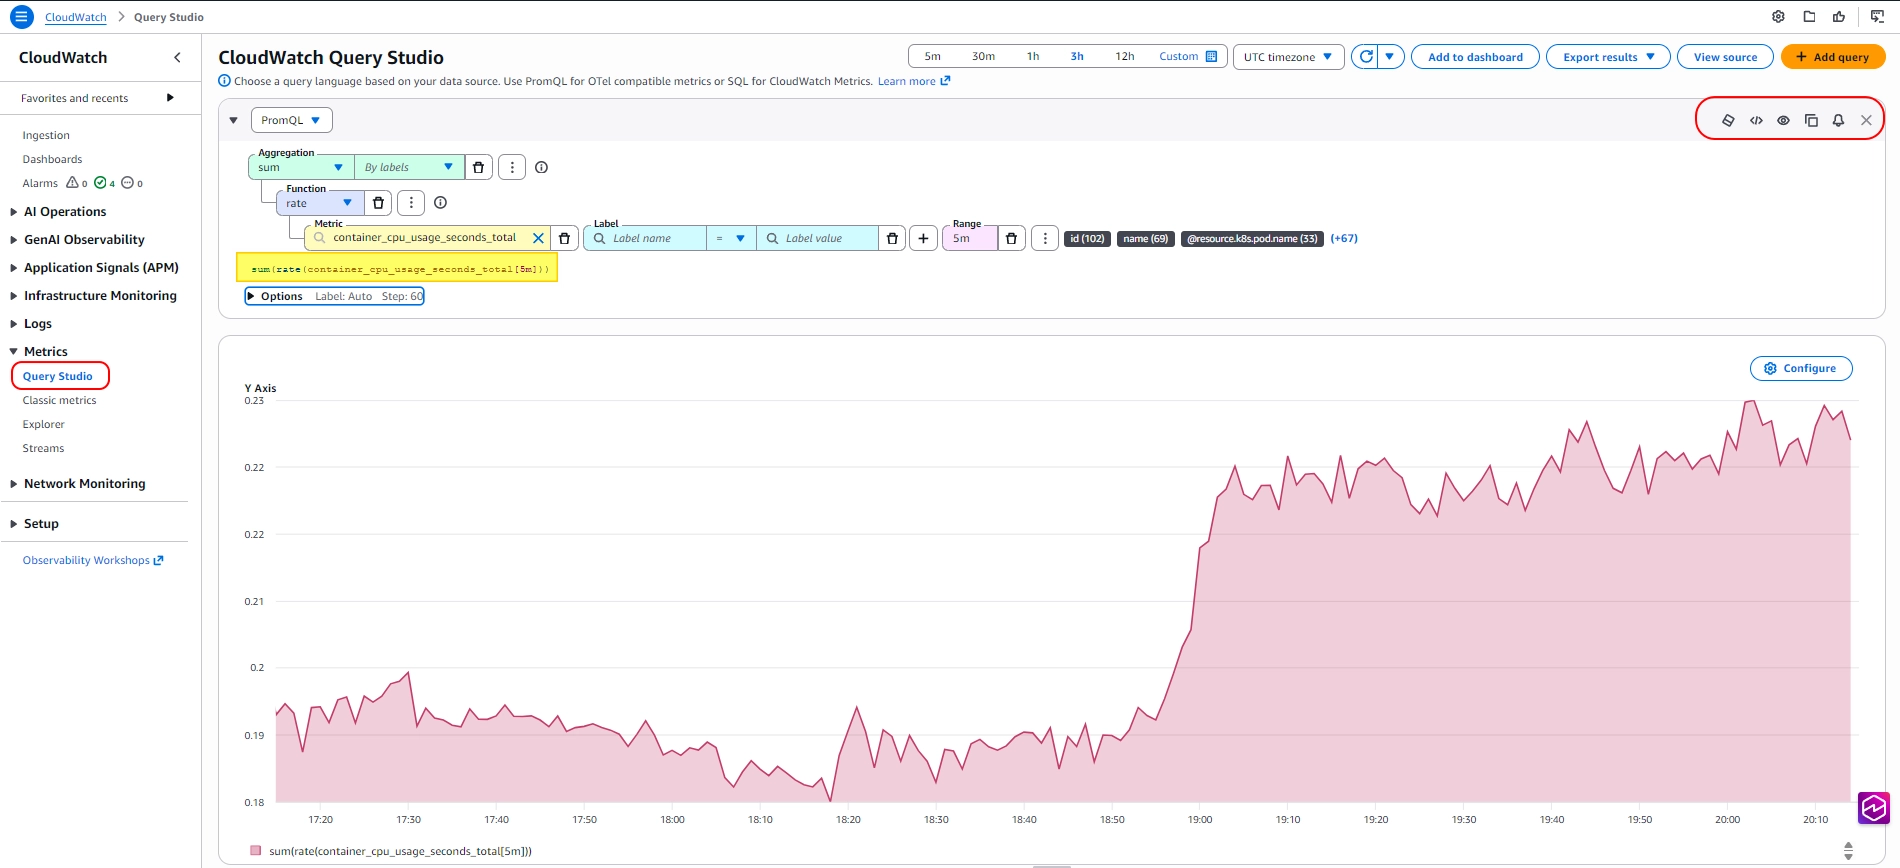
To get started, navigate to Query Studio in the CloudWatch console left navigation menu under the Metrics section, and select PromQL as the query language.
Verifying metrics collection
First, let's confirm the CloudWatch agent is running and collecting metrics from the cluster:
NAME READY STATUS RESTARTS AGE
amazon-cloudwatch-observability-controller-manager-7bf79bbjc8w5 1/1 Running 0 19m
application-metrics-collector-5bbb4675b8-6zsfb 1/1 Running 0 2m
cloudwatch-agent-cluster-scraper-7578f8fccb-8cxjm 1/1 Running 0 18m
cloudwatch-agent-pfsvk 1/1 Running 0 18m
cloudwatch-agent-wm6lp 1/1 Running 0 18m
cloudwatch-agent-zqvz8 1/1 Running 0 18m
kube-state-metrics-754d95978-7s5cp 1/1 Running 0 19m
node-exporter-78rgq 1/1 Running 0 19m
node-exporter-nlkc9 1/1 Running 0 19m
node-exporter-ztqcg 1/1 Running 0 19m
You should see cloudwatch-agent pods running on each node (as a DaemonSet), a cluster scraper, kube-state-metrics, node-exporter pods, and the application-metrics-collector deployment. These components work together to collect infrastructure and application metrics via OpenTelemetry and send them to CloudWatch.
Metrics start appearing in Query Studio within 5 minutes of the pods being ready and you can query them using PromQL or SQL syntax based queries. Go ahead and try running these below sample queries.
Cluster-level metrics
These queries provide a high-level view of overall cluster health and resource utilization.
Total cluster CPU usage — aggregate CPU consumption across all containers:
sum(rate(container_cpu_usage_seconds_total[5m]))
Average CPU usage per namespace — shows the mean CPU consumption per namespace, useful for baselining:
avg by(k8s_namespace_name) (rate(container_cpu_usage_seconds_total[5m]))
Maximum memory usage by namespace — identifies the peak memory consumer in each namespace:
max by(k8s_namespace_name) (container_memory_working_set_bytes)
CPU usage by namespace — total CPU broken down by namespace:
sum by(k8s_namespace_name) (rate(container_cpu_usage_seconds_total[5m]))
Node metrics
These queries focus on individual node health and capacity, useful for identifying hotspots or underutilized nodes.
Node CPU utilization percentage — shows how much of each node's CPU capacity is being used:
sum by(kubernetes_io_hostname) (rate(node_cpu_seconds_total{mode!="idle"}[5m])) / sum by(kubernetes_io_hostname) (rate(node_cpu_seconds_total[5m])) * 100
Minimum available memory per node — find the node closest to running out of memory:
min by(kubernetes_io_hostname) (node_memory_MemAvailable_bytes)
Node filesystem usage percentage — disk utilization as a percentage per node:
(sum by(kubernetes_io_hostname) (node_filesystem_size_bytes - node_filesystem_avail_bytes)) / sum by(kubernetes_io_hostname) (node_filesystem_size_bytes) * 100
Node count by instance type — useful for understanding your cluster's compute composition:
count by(node_kubernetes_io_instance_type) (kube_node_info)
Pod metrics
Pod-level queries help you understand workload distribution and scheduling patterns.
Pod count by namespace — gives a quick view of workload density per namespace:
sum by(k8s_namespace_name) (kube_pod_info)
Pod count by availability zone — shows how your pods are distributed across AZs:
count by(topology_kubernetes_io_zone) (kube_pod_info)
Pod count by node — identifies if pods are evenly spread or concentrated on specific nodes:
count by(kubernetes_io_hostname) (kube_pod_info)
Running pods per namespace — useful for verifying expected replica counts:
count by(k8s_namespace_name) (container_cpu_usage_seconds_total)
Container metrics
Container-level metrics give you insight in to individual workload resource consumption.
Top 5 pods by CPU usage — uses topk to surface the heaviest consumers:
topk(5, sum by(k8s_namespace_name, k8s_pod_name) (rate(container_cpu_usage_seconds_total[5m])))
Bottom 5 pods by memory — find the lightest workloads using bottomk:
bottomk(5, sum by(k8s_namespace_name, k8s_pod_name) (container_memory_working_set_bytes))
CPU usage rate per pod — drill down to individual pod CPU consumption:
sum by(k8s_pod_name) (rate(container_cpu_usage_seconds_total[5m]))
Average memory per pod — useful for right-sizing resource requests:
avg by(k8s_pod_name) (container_memory_working_set_bytes)
Network metrics
Network metrics help identify traffic patterns, bottlenecks, and imbalanced load across nodes.
Network receive rate by node — identifies which nodes are handling the most inbound traffic:
sum by(kubernetes_io_hostname) (rate(node_network_receive_bytes_total[5m]))
Network transmit rate by node — outbound traffic per node:
sum by(kubernetes_io_hostname) (rate(node_network_transmit_bytes_total[5m]))
Total cluster network throughput — combined inbound and outbound across all nodes:
sum(rate(node_network_receive_bytes_total[5m])) + sum(rate(node_network_transmit_bytes_total[5m]))
Maximum network error rate across nodes — surfaces the node with the worst network health:
max by(kubernetes_io_hostname) (rate(node_network_receive_errs_total[5m]) + rate(node_network_transmit_errs_total[5m]))
Application and service metrics
To query application-level metrics, we first need to deploy a dedicated CloudWatch Agent collector that scrapes Prometheus endpoints exposed by the workshop services. This collector is configured to scrape the orders service (Java/Spring Boot) and the checkout service (Node.js).
Deploy the application metrics collector:
amazoncloudwatchagent.cloudwatch.aws.amazon.com/application-metrics-collector created
Next, deploy a load generator to produce application traffic and generate order metrics:
Verify the application metrics collector is running:
application-metrics-collector-5bbb4675b8-6zsfb 1/1 Running 0 2m
Wait approximately 5 minutes for application metrics to start appearing in Query Studio, then try the following queries.
Total order count — aggregate count of all orders through the retail store:
sum(watch_orders_total{productId="*"}) by (productId)
Orders by product — shows which products are being ordered most frequently:
sum by(productId) (watch_orders_total{productId!="*"})
Order rate — rate of orders being placed over a 2-minute window:
sum by(productId) (rate(watch_orders_total{productId="*"}[2m]))
JDBC connection pool status — shows idle database connections for the catalog/orders services:
jdbc_connections_idle
Node.js heap size — memory usage of the checkout service runtime:
nodejs_heap_size_total_bytes
HTTP request rate by namespace — shows which services are receiving the most traffic:
sum by(Namespace) (rate(http_requests_total[5m]))
PromQL patterns reference
Here is a summary of the PromQL patterns used in the queries above, which you can adapt for your own metrics:
| Pattern | Description | Example |
|---|---|---|
sum by(label) (metric) | Aggregate and group by a label | sum by(k8s_namespace_name) (kube_pod_info) |
avg by(label) (metric) | Average value grouped by a label | avg by(k8s_namespace_name) (rate(container_cpu_usage_seconds_total[5m])) |
max by(label) (metric) | Maximum value grouped by a label | max by(k8s_namespace_name) (container_memory_working_set_bytes) |
min by(label) (metric) | Minimum value grouped by a label | min by(kubernetes_io_hostname) (node_memory_MemAvailable_bytes) |
topk(n, metric) | Top N series by value | topk(5, sum by(k8s_pod_name) (rate(container_cpu_usage_seconds_total[5m]))) |
bottomk(n, metric) | Bottom N series by value | bottomk(5, sum by(k8s_pod_name) (container_memory_working_set_bytes)) |
rate(metric[duration]) | Per-second rate of change over a time window | rate(container_cpu_usage_seconds_total[5m]) |
count by(label) (metric) | Count series grouped by a label | count by(topology_kubernetes_io_zone) (kube_pod_info) |
{label="value"} | Filter by label value | container_cpu_usage_seconds_total{k8s_namespace_name="orders"} |
metric_a / metric_b * 100 | Compute a ratio as percentage | Node CPU utilization example above |
metric_a + metric_b | Combine two metrics | Total network throughput example above |
Pinning results to a dashboard
After running any query in Query Studio, you can save the visualization to a CloudWatch dashboard:
- Run a PromQL query and review the results
- Click Actions → Add to dashboard
- Select an existing dashboard or create a new one
- The visualization is saved and will auto-refresh on the dashboard
This is useful for building operational dashboards that combine infrastructure metrics from multiple namespaces or availability zones.
Creating an alarm from PromQL
You can create CloudWatch alarms directly from any PromQL query result:
- Run a query in Query Studio (for example, the node CPU utilization query above)
- Click the bell icon next to the query result
- The alarm creation wizard opens with your PromQL expression pre-filled
- Configure the threshold (e.g., greater than 80% CPU utilization)
- Set notification actions (SNS topic)
- Name the alarm and create it
PromQL-based alarms evaluate on the same schedule as standard CloudWatch alarms. The minimum evaluation period is 1 minute.
Query Studio features
The Query Studio interface provides several capabilities to help explore metrics efficiently:
- Visual query builder — Select metrics from a dropdown, add label filters, choose aggregation functions (sum, avg, rate), and group by labels without writing raw PromQL. Click "Switch to editor" to see the generated expression.
- Multiple queries — Click + Add query to run additional queries side by side. Each query runs independently and results are displayed together for comparison.
- Configure visualization — Click the Configure button on any result to change the chart type (line chart, stacked area, bar chart) and adjust display options.