Amazon Managed Grafana Integration
Amazon CloudWatch OpenTelemetry metrics appear as a native data source in Amazon Managed Grafana. This means you can query both OpenTelemetry ingested and enriched AWS vended metrics in a single pane of glass and build dashboards in Grafana.
Access Grafana
Retrieve the Grafana URL and credentials (see Accessing Grafana):
~$kubectl get ingress -n grafana grafana -o=jsonpath='{.status.loadBalancer.ingress[0].hostname}{"\n"}'
~$kubectl get -n grafana secrets/grafana -o=jsonpath='{.data.admin-user}' | base64 -d; printf "\n"
~$kubectl get -n grafana secrets/grafana -o=jsonpath='{.data.admin-password}' | base64 -d; printf "\n"
Opening this URL in a browser will bring up a login screen.

Configure the AMP Data Source
After logging into the Grafana console, let's take a look at the datasources section.
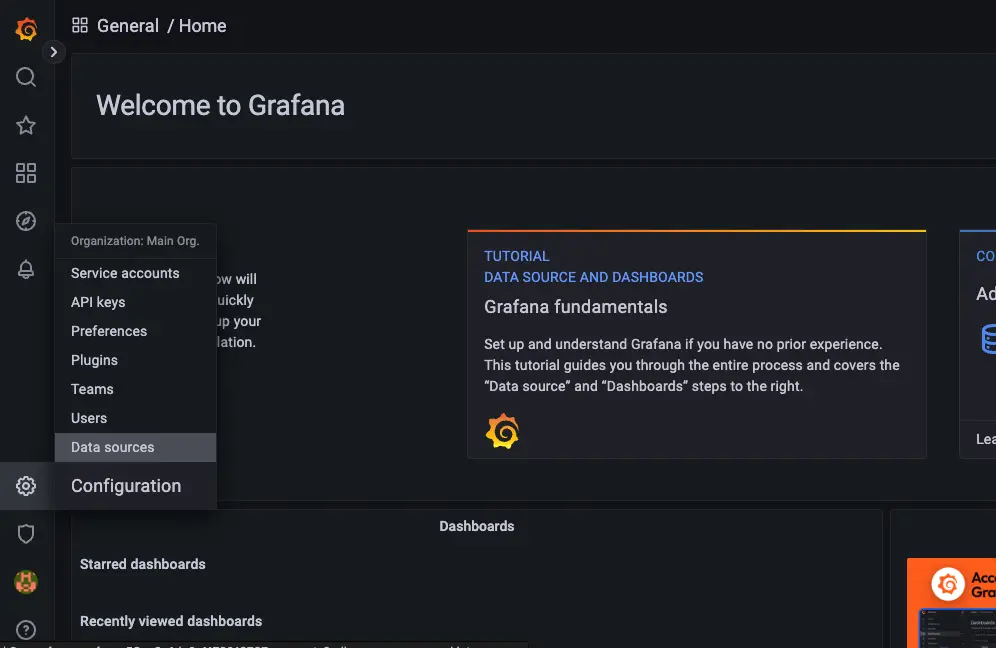
Lets manually add the Amazon Managed Service for Prometheus data source:
- Go to Connections → Data sources → Add data source
- Select Amazon Managed Service for Prometheus
- Set URL to
https://monitoring.<region>.amazonaws.com - Set Service Provider to
monitoring - Set Region to your AWS Region
- Choose Default Credential Chain as authentication provider
- Click Save & test
Refer to the official documentation: CloudWatch PromQL