OpenTelemetry & PromQL
Prepare your environment for this section:
OpenTelemetry metric ingestion
You can send OpenTelemetry metrics from any OpenTelemetry-instrumented application or collector directly to the Amazon CloudWatch OpenTelemetry endpoint https://monitoring.<aws_region>.amazonaws.com/v1/metrics using open standards, through a single protocol. This means you can use standard OpenTelemetry SDKs and collectors to ship metrics to Amazon CloudWatch natively, with no custom exporters, no sidecars translating formats, and no intermediate services required.
Enriching existing CloudWatch vended metrics
Amazon CloudWatch allows OpenTelemetry metric enrichment of existing CloudWatch vended metrics from services like EC2, RDS, ECS, etc. With OpenTelemetry metric enrichment, you can query all your metrics, both OpenTelemetry metrics-ingested and AWS vended, using PromQL in a single place.
Container Insights with OpenTelemetry
The Amazon CloudWatch Observability EKS add-on collects Container Insights metrics via the OTLP pipeline, providing cluster, node, pod, and container-level metrics for Amazon EKS. These metrics flow through the same OTLP endpoint and are queryable with PromQL alongside your application and enriched vended metrics.
Architecture
Amazon CloudWatch natively supports ingestion of OpenTelemetry Protocol (OTLP) metrics and querying them with Prometheus Query Language (PromQL). This capability provides a high-cardinality metrics store that supports up to 150 labels per metric, enabling you to send rich, label-dense metrics directly to Amazon CloudWatch without conversion or truncation and without requiring any additional or intermediate infrastructure. Combined with automatic AWS vended metric enrichment, Amazon CloudWatch becomes a unified destination for infrastructure, container, and application metrics, all queryable with PromQL.
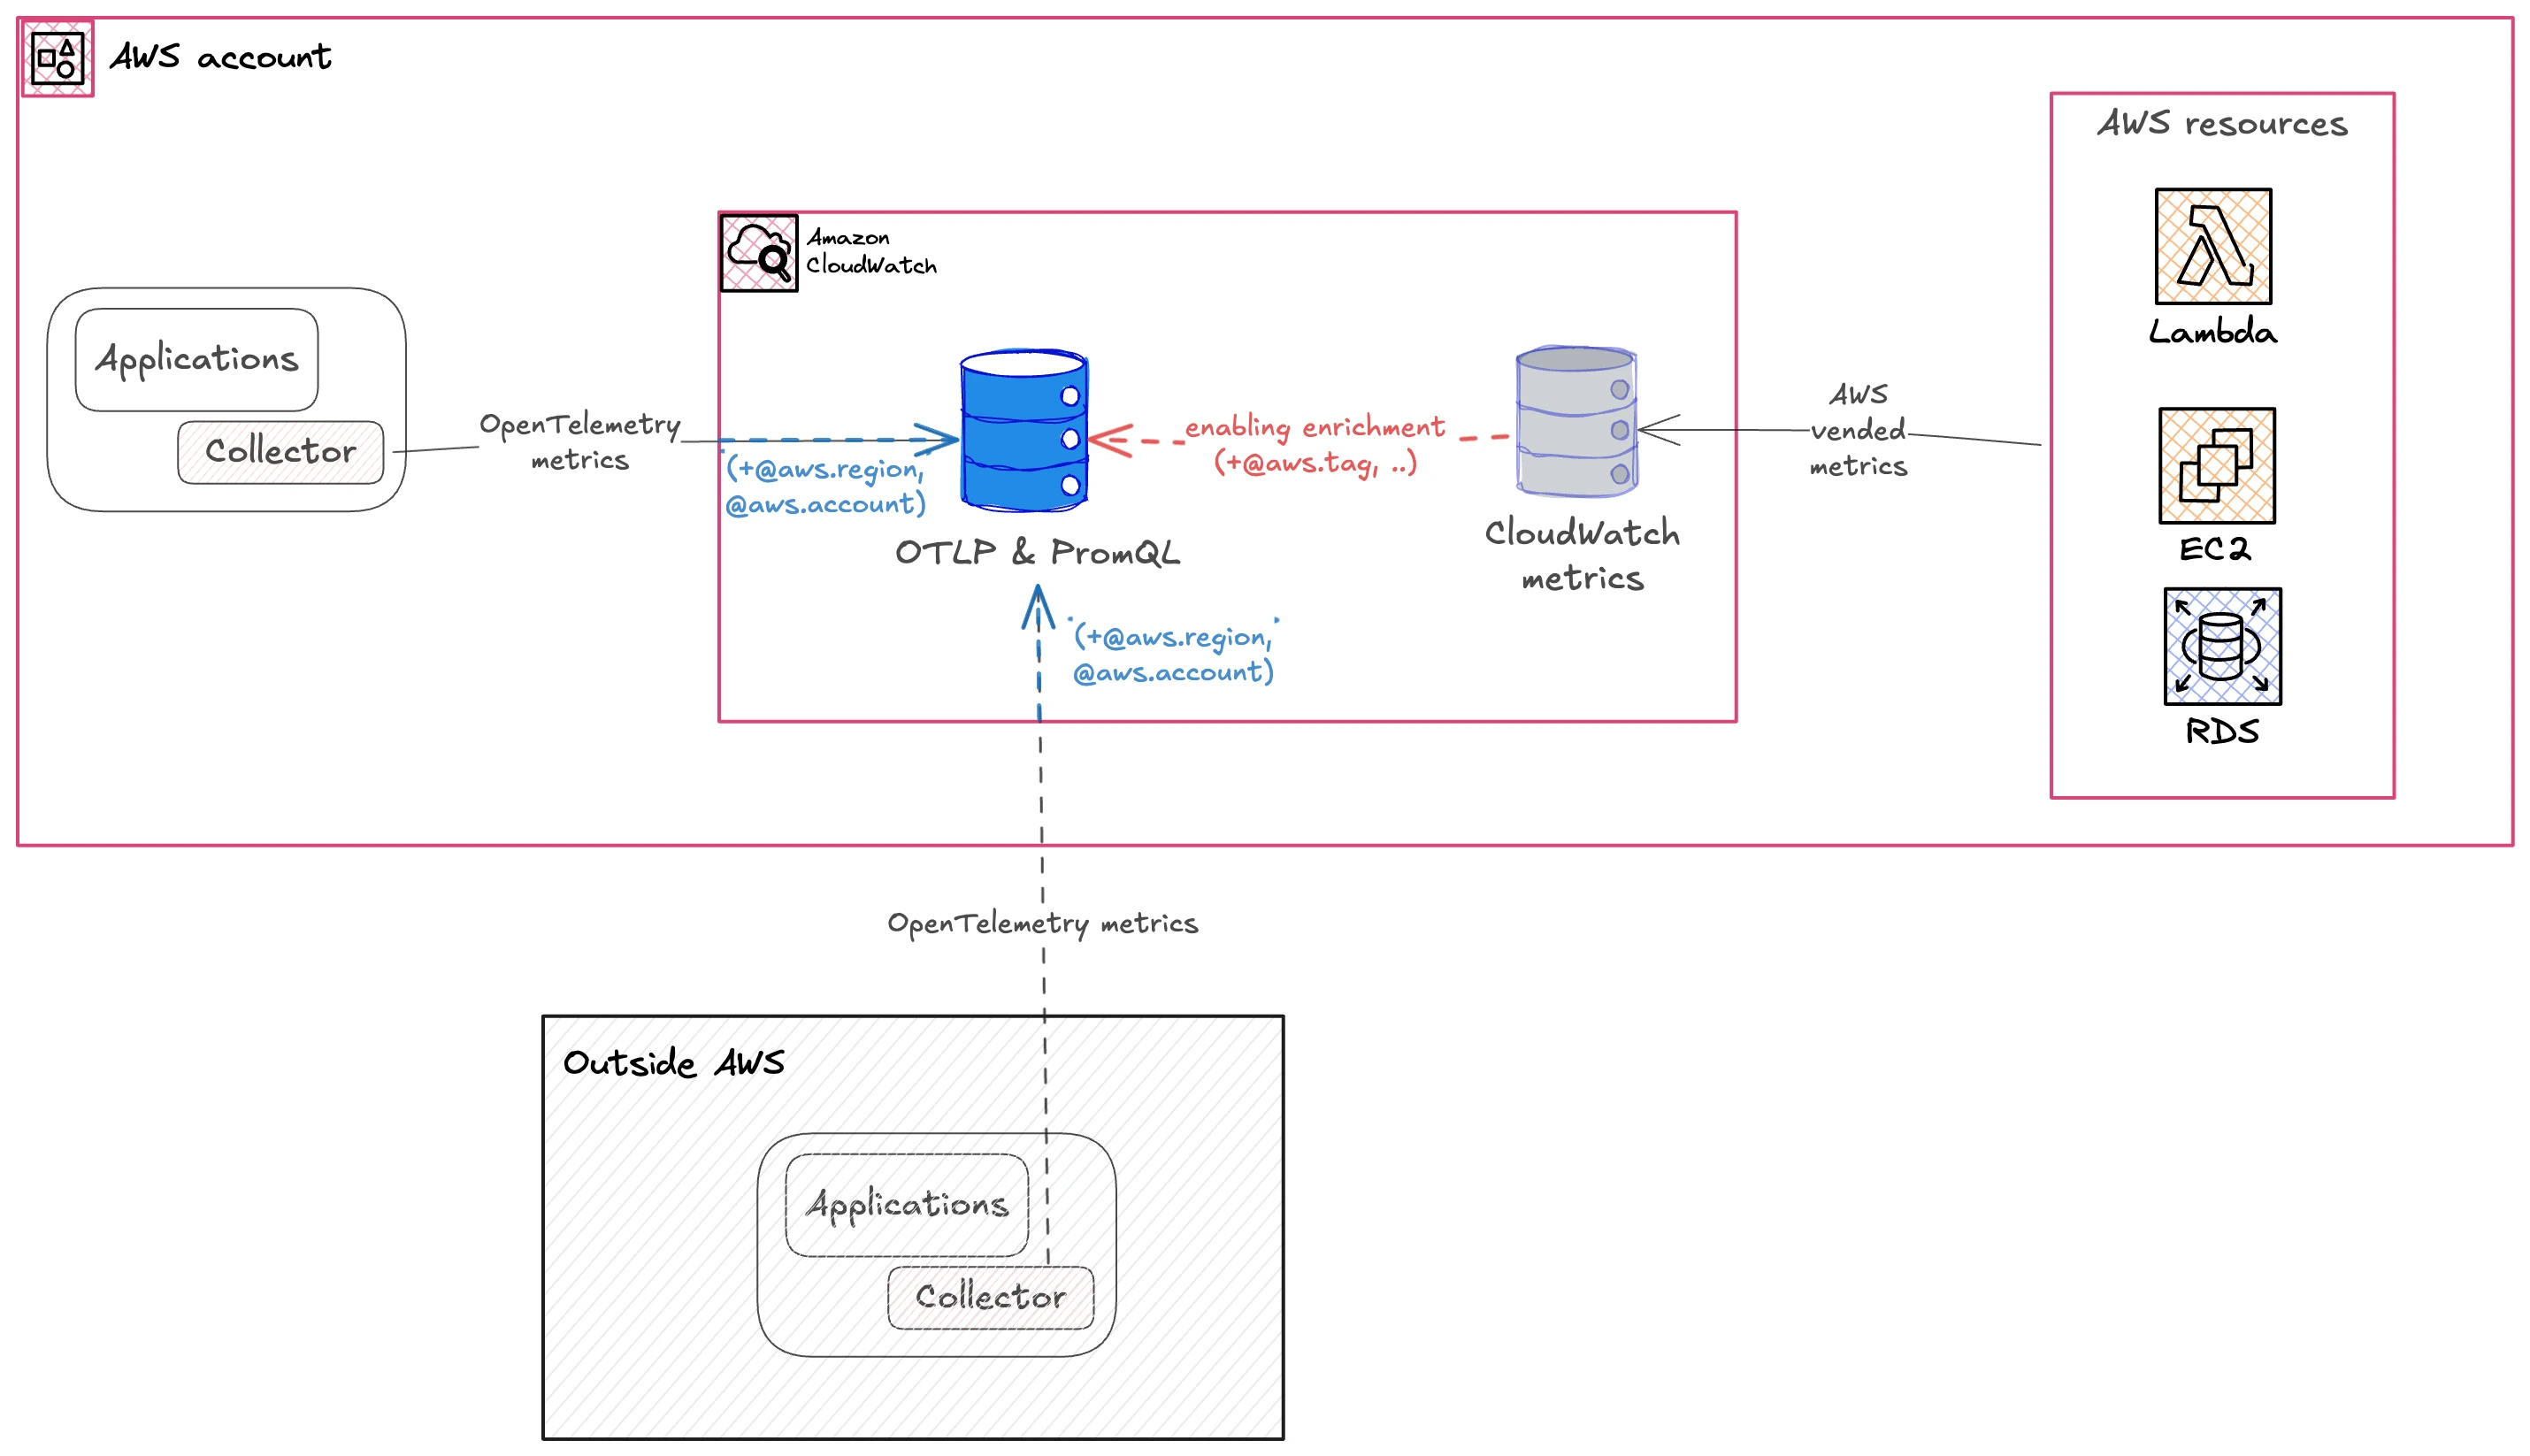
Key Capabilities
| Capability | Description |
|---|---|
| OpenTelemetry Ingestion | Send OpenTelemetry metrics to https://monitoring.<aws_region>.amazonaws.com/v1/metrics |
| OTel Container Insights | Collect cluster, node, pod, and container metrics for Amazon EKS via the OTLP pipeline |
| PromQL Queries | Query OpenTelemetry metrics using PromQL in the Amazon CloudWatch Query Studio |
| SQL Queries | Query OpenTelemetry metrics using SQL syntax in the Amazon CloudWatch Query Studio |
| Enrichment | Enrich CloudWatch vended metrics with AWS resource attributes for unified PromQL querying |
| Grafana Integration | Integrate OpenTelemetry metrics as a data source in Grafana (Amazon Managed or open source) |
| Custom Metrics | Collect application-level Prometheus metrics from ECS services via the CloudWatch Agent OTLP pipeline |
What this section covers
Here's what you'll learn:
- Enable OTel Enrichment: Enrich existing CloudWatch metrics with AWS resource attributes for unified PromQL querying
- Send Custom Metrics: Collect application metrics from petsite (.NET on EKS) and petfood (Rust on ECS) using the CloudWatch Agent
- Query with PromQL: Use Amazon CloudWatch Query Studio to query infrastructure, application, and enriched metrics
- Amazon Managed Grafana: Connect Amazon Managed Grafana and build a full-stack observability dashboard